
The Higher Education Environmental Health, Safety, and Security Workforce
By Diana Tubbs | April 2025
Introduction
This report focuses on the employees who ensure that higher education campuses are safe, secure, and free of environmental hazards. The focus of the environmental health, safety, and security (EHSS) workforce is on the protection of students, employees, and visitors, the importance of which cannot be overstated. The EHSS workforce handles and mitigates immediate hazard and safety risks, prevents potential risks, and promotes a safe and healthy campus environment. They also ensure institutions satisfy their requirements to report crime data, support victims of violence, and publicly outline the policies and procedures in place that uphold a safe campus. A particularly challenging aspect of their roles is that the EHSS workforce does not only mitigate hazards that originate within their own campus community, but also hazards that originate within the world at large, such as political unrest or the COVID-19 pandemic. This puts additional pressure on EHSS employees to remain particularly vigilant to risks on and off campus to perform their jobs effectively.
There is a lack of research on the higher ed EHSS workforce. Most publications regarding campus health, safety, and security focus on student outcomes, and these publications are markedly sparse for higher education, specifically. This report offers insights on EHSS employees in higher ed using CUPA-HR’s higher education workforce survey data.1CUPA-HR. (2024) Administrators, Professionals, and Staff in Higher Education Surveys, 2023-24 [Data set]. For these positions, this report examines staffing, pay and pay equity, representation, age, and years in position. Analyses for staffing, age, and years in position compare academic years 2019-20 and 2023-24 to determine differences from before the COVID-19 pandemic to after the COVID-19 pandemic. Analyses for representation and pay equity display data from 2016-17 to 2023-24.
The findings in this report indicate that the number of employees in EHSS positions in a given institution, as well as their pay, depends on the institution’s size, as measured by the number of full-time equivalent students. Additional findings highlight the need to improve the representation of women, decrease pay gaps for people of color, and promote retention across the EHSS workforce. The data in this report should be used as a resource for higher ed leaders to improve or enhance their EHSS workforce.
Environmental Health, Safety, and Security Positions
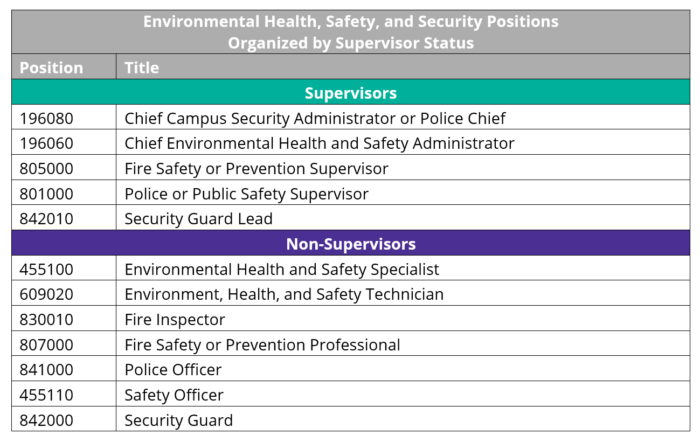
EHSS employees were included in this report if they were reported in one of the 12 positions displayed in Table 1. In 2023-24, 16,875 EHSS employees were reported across 892 institutions in CUPA-HR’s higher ed workforce surveys.2Data on chief campus security administrators and chief environmental health and safety administrators are collected in the CUPA-HR Administrators in Higher Education Survey. Data on fire safety supervisors; police supervisors; fire safety professionals; and safety officers are collected in the CUPA-HR Professionals in Higher Education Survey. Data on security guard leads; environment, health, and safety technicians; fire inspectors; police officers; and security guards are collected in the CUPA-HR Staff in Higher Education Survey. See the Survey Participation and Information Templates of each survey for full position descriptions. Each year of data contains at least 11,826 incumbents from at least 816 institutions. The positions in Table 1 are further organized by whether they are supervisory or not. Chief-level positions manage and direct programs and large units, such as environmental safety, police units, and security programs. Supervisor-level positions serve as the direct point of contact between employees and chief positions. Supervisors manage frontline workers and ensure that tasks are completed, productivity is maintained, and policies are enforced. The lead-level position reports to the supervisor and performs tasks such as training new employees, mentoring current employees, and supporting daily operations. Finally, all non-supervisor positions focus primarily on their own individual tasks and responsibilities. A few examples of these tasks are testing environmental conditions for hazards, detecting individuals who break the law, and coordinating functions of a health and safety program.3Ibid. Details on individual positions are available in CUPA-HR’s Survey Participation and Information Templates.
Table 1. Environmental Health, Safety, and Security Positions Organized by Supervisor Status
Representation and Pay
Women Are Notably Underrepresented in EHSS Positions, but People of Color Have High Representation
Figure 1 shows the composition of EHSS positions by gender, race/ethnicity, and supervisor status. Women represent 1 out of 5 (20%) employees in EHSS positions, a pattern that has held since 2016-17. This stands in contrast to the rest of the higher ed workforce, where women represent more than half of higher ed administrators, professionals, and non-exempt staff.4CUPA-HR. (2024). Workforce Composition and Pay Equity [Online graphics]. Since 2016-17, women’s representation has been even lower within supervisor positions (17%) than non-supervisor positions (22%). This contrasts with data from the CUPA-HR Administrators in Higher Education Survey, where women represent 55% of higher ed administrators.5CUPA-HR. (2024). Administrators in Higher Education Survey, 2023-24 [Data set].
In comparison, people of color represent more than one-third (37%) of employees in EHSS positions.6The term “people of color” to refers to people who identify as Asian; Black; Hispanic or Latina/o; Native American or Alaska Native; Native Hawaiian or Other Pacific Islander; or two or more races. This notable level of representation surpasses the proportion of people of color in higher ed staff positions (33%), which consist primarily of non-exempt employees.7CUPA-HR. (2024). Staff in Higher Education Survey, 2023-24 [Data set]. Non-exempt staff generally have the highest representation of people of color when compared to all other higher ed employee categories.8Ibid. However, it is men of color who underlie this representation, as the proportion of women of color in EHSS positions is much lower when compared to non-exempt staff, with women of color representing 9% of EHSS employees versus 20% of non-exempt staff. The representation of male supervisors of color in EHSS positions increased from 19% in 2016-17 to 24% in 2023-24. This representation is double the representation of male higher ed leaders of color (12%) in 2023-24.9Ibid.
Figure 1. Composition of Environmental Health, Safety, and Security Employees by Gender and Race/Ethnicity
Black Female Supervisors and Hispanic Male Supervisors Have Experienced the Largest Pay Gaps
Figure 2 shows the median pay ratios for EHSS employees by gender, race/ethnicity, and supervisor status.10Due to smaller sample sizes and limited generalizability, median pay ratios for Native American or Alaska Native; Native Hawaiian or Other Pacific Islander; or two or more races were excluded from pay ratio analyses. Among non-supervisors, all racial/ethnic groups were paid less than their White male counterparts in 2020-21, the year following the start of the COVID-19 pandemic.11Data for 2020-21 were reported effective November 1, 2020, several months after the start of the COVID-19 pandemic. Since that year (2020-21), median pay ratios improved for all racial/ethnic groups of non-supervisors except Black women. Black women were the only racial/ethnic group of non-supervisors who were paid inequitably in 2023-24, with a median pay ratio of $0.94 to the dollar paid to White men. Among supervisors, Hispanic men had the lowest median pay ratios compared to all other racial/ethnic groups since 2016-17, and were paid $0.92 to the dollar White men were paid in 2023-24. For supervisors, median pay ratios were higher overall compared to non-supervisors and there was no clear pattern of change that coincided with the COVID-19 pandemic.
Figure 2. Median Pay Ratios for Environmental Health, Safety, and Security Employees by Gender and Race/Ethnicity
Age and Tenure
The Age Distribution of the EHSS Workforce Is Robust
Figure 3 shows the distribution of ages for the EHSS workforce and the percentage of employees at each age in 2019-20 and 2023-24.12Age data is based on the number of employees at each age from 18-80. For each reported age, the median age was calculated across all incumbents of the same age. Data for 2019-20 included 12,005 non-supervisors and 2,849 supervisors across 747 institutions. Age data for 2023-24 included 13,464 non-supervisors and 3,411 supervisors across 708 institutions. The age distribution of non-supervisors has shifted slightly younger from before the COVID-19 pandemic to after. In 2023-24, 60% of employees were younger than 50 years old compared to 58% in 2019-20, and 40% were ages 50 and older compared to 42% in 2019-20. This shows that the EHSS workforce has a robust representation of older and younger workers in non-supervisor roles.
The shift to younger representation in supervisors was larger. In 2019-20, 39% of supervisors were younger than 50 and 61% were 50 and older. In 2023-24, 45% of supervisors were younger than 50 and 55% were 50 and older. This change in age distribution indicates that since before the COVID-19 pandemic, EHSS supervisor ages have shifted to be slightly younger. In sum, the broad age range of non-supervisors, as well as an increase in younger supervisors suggests a healthy pipeline to replace EHSS supervisors who will retire in the next 10-15 years.13It is important to note that this analysis did not include a review of vacant positions, particularly entry-level positions, and any recruitment challenges institution leaders are encountering to fill these positions.
Figure 3. Distribution of Age for Environmental Health, Safety, and Security Employees
Job Tenure in the EHSS Workforce Is Shorter Since COVID-19
Figure 4 shows the median number of years in position for the EHSS workforce in 2019-20 and 2023-24 by supervisor status.14For each reported EHSS position, the median years in position was calculated across all incumbents of the same position. Data for 2019-20 included 12,005 non-supervisors and 2,849 supervisors across 787 institutions. Age data for 2023-24 included 13,464 non-supervisors and 3,411 supervisors across 699 institutions. ,15CUPA-HR data on years in position assesses the number of years an incumbent has been in their position at their current institution. It is not a measure of total years of experience in the position. Overall, all EHSS employees had longer tenure in 2019-20 than in 2023-24. In particular, fire safety or prevention supervisors had a marked decrease at a median of 10 years in position in 2019-20 to 4 years in position in 2023-24. Among non-supervisors, fire safety or prevention professionals had the shortest tenure of all positions both years with 3 years in position in 2019-20, and 1 year in position in 2023-24. In both years, supervisors tended to have longer tenure than non-supervisors. In 2023-24, supervisors had a median range of 3-6 years in position, and non-supervisors had a median range of 1-3 years in position.
The notable decrease in tenure indicates that the EHSS workforce has experienced challenges with retention within the past four years. In 2023, the CUPA-HR Higher Education Employee Retention Survey asked higher ed employees about aspects related to retention, including whether they intended to look for other employment opportunities, and why they would seek new work opportunities.16Bichsel, J., Fuesting, M., Tubbs, D., and Schneider, J. (2023). The CUPA-HR 2023 Higher Education Employee Retention Survey. CUPA-HR. ,17This survey collected data between April 10 and April 23, 2023. Findings from that survey indicate that reducing overwork, providing pay raises where possible, and ensuring employee protection from health or safety concerns can help increase retention of EHSS employees.18Ibid.
Figure 4. Median Years in Position for Environmental Health, Safety, and Security Employees
Police and Security Positions Comprise the Largest EHSS Group on Campus
Figure 5 shows the proportion of institutions that reported EHSS positions and the median number of employees per institution.19Data included 3,040 EHSS employees across 957 institutions for 2019-20, and 3,155 EHSS employees across 892 institutions in 2023-24. Of institutions that reported any EHSS position, most reported chief of campus security or police chief (75%), security guards (51%), and police officers (45%) in 2023-24. The least frequently reported positions were fire safety/prevention professional (9%), fire safety/prevention supervisor (6%), and fire inspector (5%) in 2023-24. These patterns were identical in 2019-20. Given the relatively small proportion of institutions that reported having many of these EHSS jobs, it is likely that institutions are outsourcing these EHSS roles. For example, 2- and 4-year institutions with more than 1,000 full-time students typically have separate law enforcement agencies that provide campus police/security departments.20Davis, E. (2024, November). Campus Law Enforcement Agencies Serving 4-year Institutions, 2021-2022 – Statistical Tables. Therefore, while half or less of institutions reported security guards or police officers, it’s likely that far more institutions have those roles filled but did not report them on CUPA-HR surveys because they are managed by a separate unit.21Data for outsourced positions are not reported on any of CUPA-HR’s workforce surveys and, therefore, do not appear in this report.
Next, we calculated the median number of employees in 2023-24 per position. Institutions were included in the analysis pictured in Figure 5 only if they reported at least one employee in the position’s relevant group (i.e. police/security group, environmental health/safety group, or fire safety group).22For instance, the median number of employees for the police/security group is based only on institutions that reported at least one employee in a police/security position. The police/security group was the largest with a median of 25 employees across 6 positions.23The police/safety group included chief campus security administrators; police/safety supervisors; security guard leads; police officers; security guards; and safety officers. The environmental health/safety group was the next largest, yet much smaller, with a median of 4 employees across 3 positions.24The environmental health/safety group included chief environmental health/safety administrator; environmental health/safety specialist; and environment, health/safety technician. Finally, the fire safety group was the smallest with a median of 3 employees across 3 positions.25The fire safety group included fire safety supervisor; fire safety inspector; and fire safety professional. Therefore, police/security groups are likely to be about 6-8 times bigger than environmental health/safety or fire safety groups on campus. The median number of employees across all 12 EHSS positions per institution was 29 in 2019-20 and 32 in 2023-24, a 10% growth in workforce size from before the COVID-19 pandemic to after.26These figures do not account for outsourced positions.
Figure 5. Proportion of Institutions That Reported Environmental Health, Safety, and Security Positions and Median Number of Employees Per Institution
Conclusions
This report provides an in-depth analysis of the environmental health, safety, and security workforce in higher education with data from CUPA-HR’s workforce surveys. Institutions rely on EHSS employees to protect all individuals on campus at all times, and no publications exist to date that provide valuable data on the EHSS workforce. The following conclusions provide key results from the analyses performed with CUPA-HR’s survey data.
People of color are well represented among EHSS employees, but women are markedly underrepresented. Despite good representation of people of color, women represent just 20%, and women of color just 9%, of the EHSS workforce. These statistics have not changed since 2016-17 and stand in contrast to other employee populations in higher ed which have traditionally comprised at least 50% women.
Pay equity has been lowest for Black female non-supervisors and Hispanic male supervisors. Among non-supervisors, all racial/ethnic groups were paid less than their White male counterparts following the start of the COVID-19 pandemic in 2020-21. Median pay ratios for non-supervisors showed improvement in 2023-24 across all races/ethnicities, except for Black women. Among supervisors, Hispanic men have had particularly low median pay ratios in comparison to all other racial/ethnic groups since 2016-17.
The ages of supervisors and non-supervisors suggest that the EHSS workforce has a stable pipeline. Non-supervisors have had good representation of both younger and older workers since 2019-20. In particular, supervisors’ ages have shifted to represent more younger workers since 2019-20. The broad age range of non-supervisors as well as the increase in younger supervisors suggests a strong pipeline to replace aging EHSS supervisors.
EHSS employee job tenure has decreased substantially since 2019-20. Both supervisors and non-supervisors tended to stay in their positions for a longer time before the COVID-19 pandemic compared to 2023-24. The evidence points to retention challenges in the EHSS workforce.
Police/security positions represent the largest number of EHSS employees. Half or less of institutions reported 11 of the 12 EHSS positions analyzed, indicating that institutions typically outsource EHSS positions. The proportion of institutions that report an EHSS position is highest for police/security-related positions, and lowest for fire safety-related positions. In addition, police/security positions account for 78% of the EHSS workforce and environmental health/safety and fire safety positions combined account for the remaining 12%. The EHSS workforce has experienced modest growth since 2019-20.
Recommendations
The data in this report highlight the need to increase the representation of women, continue efforts to improve pay equity, and promote retention for the EHSS workforce. The following recommendations are synthesized across the main findings in this report for higher ed leaders to consider.
- Increase efforts to recruit more women for both supervisor and non-supervisor-level positions. Although the EHSS workforce has a high proportion of people of color, 80% of employees are men. Recruit more women for training and education in EHSS positions, and review hiring policies and position descriptions for potential biases that may discourage women from applying.
- Conduct a pay equity analysis for EHSS employees that includes comparisons to institutions of similar size.27CUPA-HR maintains a list of resources for HR professionals interested in learning more about pay equity, including a webinar that introduces the process of conducting a pay equity analysis. Commit to improving pay equity particularly for Black female non-supervisors and Hispanic male supervisors. Inform leadership of efforts required to improve pay equity and monitor progress over time.
- Aim to improve employee retention. Though the EHSS workforce age appears to span a wide range, job tenure is a major challenge. Prioritize improving tenure for non-supervisors, as that group has higher turnover, and consider other factors that affect retention as outlined in the recommendations of the CUPA-HR 2023 Higher Education Employee Retention Survey.28Bichsel, J., Fuesting, M., Tubbs, D., and Schneider, J. (2023). The CUPA-HR 2023 Higher Education Employee Retention Survey. CUPA-HR.
About the Authors:
Diana Tubbs, Ph.D., is a senior survey researcher at CUPA-HR.
Graphics were created by Kate Roesch, data visualization developer at CUPA-HR.
Citation for This Report:
Tubbs, Diana. (2025, April). The Higher Education Environmental Health, Safety, and Security Workforce. CUPA-HR. https://www.archive.cupahr.org/surveys/research-briefs/higher-ed-environmental-health-safety-and-security-workforce-april-2025/
Printer-friendly Version 1 CUPA-HR. (2024) Administrators, Professionals, and Staff in Higher Education Surveys, 2023-24 [Data set].