
Two Decades of Change: Faculty Discipline Trends in Higher Education
By Brielle Johnson and Melissa Fuesting | May 2025
Introduction
In recent years, higher education institutions have faced pressure to prioritize certain disciplines over others.1Ahmed, S. (2024, July 8). The Death of Humanities Education: Why We Need to Revalue the Arts and Sciences. Medium. Financial strain and a looming “enrollment cliff” have compelled colleges and universities to make strategic decisions about allocating their limited resources.2Dickeson, R. C. (2010). Prioritizing Academic Programs and Services: Reallocating Resources to Achieve Strategic Balance, Revised and Updated. John Wiley & Sons. ,3Boeckenstedt, J. (2022, March 22). Will Your College Survive the Demographic Cliff?. The Chronicle of Higher Education. In particular, there have been heightened pressures to emphasize disciplines that are in greater demand by students or perceived by the public as translating directly from degree to career. Degrees in health professions and science, technology, engineering, and mathematics (STEM) fields have risen in popularity among recent graduates, likely as a result of labor market projections of growth in these areas and their practical application in the workforce.4Nietzel, M. T. (2022, July 24). The Five Most Significant Ten-Year Trends In College Majors. Forbes. ,5U.S. Bureau of Labor Statistics (2024, August 29). Fastest Growing Occupations. These changes in student demand and public need have contributed to a de-emphasis on humanities and the liberal arts and an increased emphasis on business, health, and STEM fields across higher ed.6Dutt-Ballerstadt, R. (2019, February 28). Academic Prioritization or Killing the Liberal Arts?. Inside Higher Ed. ,7Curry, D. C. K. (2024, April 8). The Gutting of the Liberal Arts. The Chronicle of Higher Education.
Shifts in the prioritization of disciplines are marked by changes in course offerings, department structures, and research and teaching investments. This report takes a longitudinal approach to provide insights on how academic disciplines have changed over time in terms of faculty salaries, tenure status, and headcount. We examined trends across and within disciplines to explore how recent historic events (e.g., the Great Recession and the COVID-19 pandemic) and shifting priorities may have impacted the higher education faculty workforce.
The Data
This report investigates trends over the past 20 years in the salaries, tenure status, and number of faculty across academic disciplines using data from the CUPA-HR Faculty in Higher Education Survey from 2003-04 to 2023-24.8CUPA-HR. (2024). Faculty in Higher Education Survey, 2003-04 to 2023-24. The Faculty in Higher Education Survey has served as an industry benchmark for faculty salaries by academic discipline since CUPA-HR began collecting this data in 1981-82.9CUPA-HR’s Faculty in Higher Education Survey collects base salary data for faculty, among other variables. Base salaries are used in all salary analyses included in this report. This survey is administered annually, providing up-to-date information on recent and historic trends in faculty disciplines. Recent advancements in CUPA-HR’s data collection methods offer opportunities to provide nuanced insights into faculty trends, including comparisons of the proportion of tenure-track (TT) faculty to non-tenure-track (NTT) faculty by discipline over time.
The Analyses
This report describes trends across academic disciplines over the past 20 years and addresses the following questions: 1) How has an increased prioritization of higher demand programs impacted the size and pay of various disciplines? 2) Do ratios of TT to NTT faculty vary by discipline? 3) Have changes in faculty data trends coincided with recent historic events? The report also highlights noteworthy differences across disciplines regarding growth and pay from 2003-04 to 2023-24.
First, we will start with a review of trends in faculty discipline size. We will present changes in discipline size from 2003-04 to 2023-24, including an analysis of recent new assistant professor appointments by discipline.10Each salary and size analysis includes data from at least 531 institutions and a minimum of 494 incumbents per discipline. Then, we will cover changes in proportions of TT to NTT faculty across disciplines over time. Finally, we will highlight various trends in faculty salaries by discipline over the past 20 years, including how discipline salaries compare to inflation rates.
The concluding section of this report will synthesize insights across analyses and provide key takeaways for higher ed leadership. Across various indices, the faculty disciplines of Business; Health Professions; Biological/Biomedical Sciences; Engineering; and Legal Professions fared better than other disciplines in terms of salaries, raises, and growth. On the other hand, disciplines including English Language/Literature; Liberal Arts and Humanities; Consumer Sciences; Education; and Theology generally fared worse than other disciplines across the same metrics.
Faculty Disciplines
CUPA-HR’s Faculty in Higher Education Survey collects data annually for tenure-track and non-tenure-track faculty by discipline. Disciplines are defined using the U.S. Department of Education’s Classification of Instructional Programs (CIP).11CUPA-HR uses the Classification of Instructional Programs (CIP) developed by IPEDS to collect data by faculty discipline. The National Center for Education Statistics website provides detailed descriptions for 2-digit, 4-digit, and 6-digit CIP codes. CIP codes provide a consistent structure for tracking and reporting data on fields of study across institutions. CIP codes range from 2-digit to 6-digit, with 6-digit being the most specific way to classify discipline and 2-digit being the broadest. An example of a 6-digit CIP code is (26.0204) Molecular Biology, which is nested under the broader 2-digit CIP (26) Biological and Biomedical Sciences. For the Faculty Survey, institutions match their faculty members to the most appropriate CIP code. This report focuses on 2-digit CIP codes for clarity and to maximize data availability.
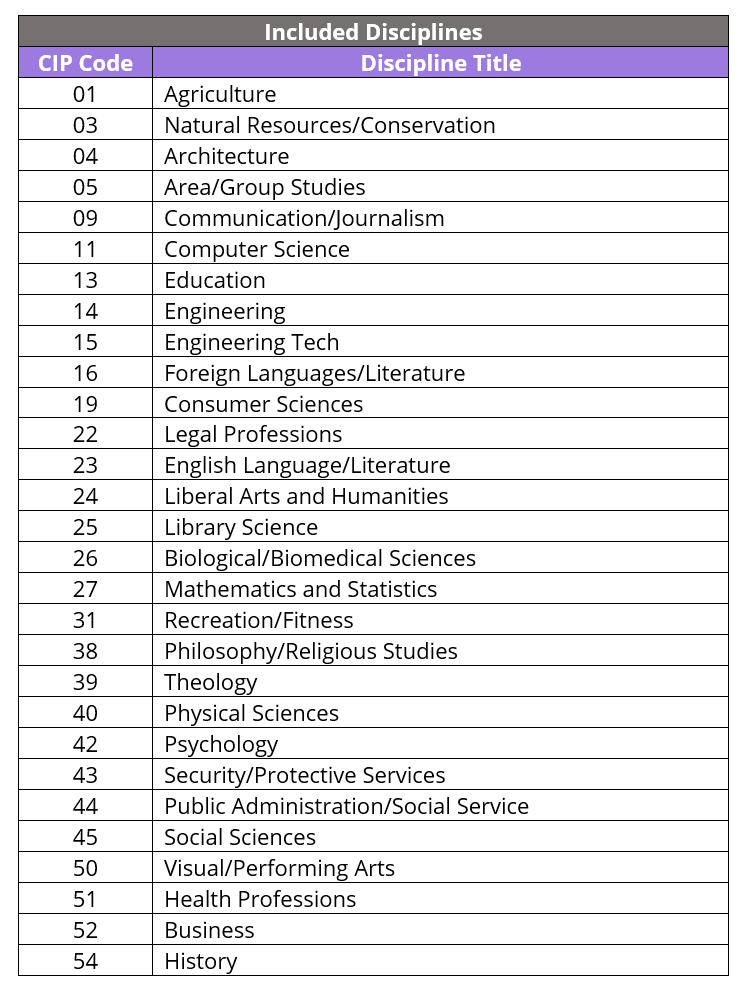
For this report, we reviewed data on 29 disciplines.12Not all disciplines included in the Faculty Survey were included in analyses for this report due to low faculty headcounts (less than 300 faculty). To best allow for longitudinal comparisons, we only included disciplines that have been consistently collected over time in the survey. Multi/Interdisciplinary Studies [CIP: 30] was not included as it is exceptionally broad and difficult to interpret. Table 1 provides the CIP codes and corresponding discipline titles included in this report; some discipline titles have been abbreviated.
Table 1. Faculty Disciplines and 2-Digit CIP Codes
Trends in Faculty Discipline Size From 2003-04 to 2023-24
Most Disciplines Increased in Size Over the Past 20 Years
Figure 1 shows the overall percentage change in size from 2003-04 to 2023-24 for each discipline. Both tenure-track and non-tenure-track teaching faculty were included in analyses looking at discipline size changes.13Institutions were included in this analysis if they reported faculty in a particular discipline in both years of observation (i.e., 2003-04 and 2023-24). Several disciplines had fewer faculty members in 2023-24 compared to 2003-04. Disciplines with shrinking faculty numbers included Engineering Tech; English Language/Literature; Liberal Arts and Humanities; Consumer Sciences; and Education. Alternatively, other disciplines showed growth during this time. Of particular note was Health Professions, which more than doubled the number of faculty reported in 2023-24 compared to 2003-04. This major expansion of faculty in Health Professions likely reflects an increased emphasis on programs that are in high demand and offer clear career paths. In addition, institutions may be experiencing higher enrollment rates in Health Professions due to shortages in the healthcare workforce and increasing healthcare demands related to an aging U.S. population.14Owens, C. (2024, March 8). Aging Population Puts Pressure on Health Care Labor. Axios. Other disciplines with substantial growth over the past 20 years included Library Science; Biological/Biomedical Sciences; Area/Group Studies; and Security/Protective Services.
Figure 1. Median Overall Percentage Change in Size From 2003-04 to 2023-24
Most Disciplines Decreased in Size Following the COVID-19 Pandemic
Figure 2 provides a more detailed breakdown in the percentage change in size by discipline each year from 2003-04 to 2023-24.15For each two-year span of data reported, only institutions providing data in both years of that comparison were included in the analysis. Tenure-track and non-tenure-track teaching faculty were included in analyses. In this figure, data labeled as “2004” reflect percentage change in size from 2003-04 to 2004-05 and so on. Note – size change for Agriculture from 2018 to 2019 is an outlier (i.e., 46.6%) and is not displayed due to axis constraints. As highlighted in other research, the COVID-19 pandemic impacted the number of people employed across higher ed as colleges and universities reduced hiring or laid off employees due to lower enrollment rates and strained finances.16Lederman, D. (2021, December 13). How the Pandemic Shrank the Higher Ed Workforce. Inside Higher Ed. CUPA-HR has similarly documented consistent decreases in the number of tenure-track faculty since the start of the pandemic.17CUPA-HR. (2024). Changes in Workforce Size. Although this trend appears to be prevalent across institutions, programs within institutions were likely differentially impacted as institutions had to prioritize where to allocate further constricted resources.
Based on CUPA-HR’s data collection schedule, the year marked 2020 in Figure 2 below includes the first year of data that was post-COVID and would reflect any pandemic-related effects.18CUPA-HR data collections follow a consistent, annual cycle. Data collected for the 2019-20 survey cycle reflect salaries and headcounts as of November 1, 2019. Therefore, the 2020-21 survey cycle, which reflects salaries and headcounts as of November 1, 2020, would be the first survey to show COVID-19 pandemic-related impacts. In Figure 2, the year marked 2020 reflects the percentage change in faculty size between academic years 2019-20 and 2020-21. As shown in Figure 2, most disciplines showed reduced numbers of faculty members each year from 2020 to 2022. A few exceptions included Area/Group Studies; Computer Science; Security/Protective Services; Public Administration/Social Service; and Health Professions. These disciplines continued to grow during this period, whereas all other disciplines reported decreases in faculty size each year between 2020 and 2022. This may be due in part to many of the noted disciplines having relatively high proportions of non-tenure-track faculty, which were more resilient against pandemic-related job losses.19CUPA-HR. (2024). Changes in Workforce Size. Comparisons of tenure-track to non-tenure-track faculty by discipline will be discussed in more detail in a subsequent section of this report.
We also examined changes in discipline size following the Great Recession of 2008, which lasted 18 months. The year marked 2008 in Figure 2 reflects the percentage change in faculty size between academic years 2007-08 and 2008-09 and would be the first period impacted by the Great Recession. Interestingly, we did not identify notable decreases in number of faculty for any discipline from 2008 to 2010, reflecting the years directly following the start of the recession. Further, only three disciplines had a decrease in faculty in 2008, the smallest number of disciplines to show a decline in faculty size from 2003-04 to 2023-24. Although this may seem counterintuitive, past research suggests financial crises are often associated with increases in college and university enrollment.20Turner, S.E. (2014). The Impact of the Financial Crisis on the Faculty Labor Markets. National Bureau of Economic Research. As a result, higher ed faculty positions may be less vulnerable to reductions in response to events like the Great Recession compared to jobs in other employment sectors. Although faculty may benefit from job security in the face of financial crises, subsequent sections of this report will examine how salary changes coincide with major historic and economic events.
Several disciplines experienced relatively consistent growth or decline in faculty size over time. For example, Education and Engineering Tech had a decrease in number of faculty most years (15 of 20) between 2003-04 and 2023-24. Another noteworthy decline in faculty size was History, which saw reductions in number of faculty every year since 2015. In contrast, other disciplines showed consistent growth. For example, Computer Science experienced relatively large growth each year from 2012. Engineering also saw consistent growth in faculty size over time, with increases in number of faculty every year except for 2021. Other disciplines that reported growth most years included Security/Protective Services (18 of 20 years), Public Administration/Social Services (17 of 20 years), Biological/Biomedical Sciences (16 of 20 years), Physical Sciences (15 of 20 years), and Psychology (15 of 20 years). These trends align with shifts in discipline valuation, as disciplines with more consistent growth tended to be STEM fields or those with clear degree-to-career paths.
Figure 2. Median Percentage Change in Size Across Time From November 2003-04 to November 2023-24
Business Had the Highest Rate of Hiring New Assistant Professors in 2023-24
Figure 3 depicts the percentage of institutions reporting new assistant professors for each discipline in academic year 2023-24. Tenure-track faculty positions are typically hired at the new assistant professor level, so changes in number of new assistant professors provide a proxy for changes in size for disciplines and an indicator of discipline growth. As an example, in Figure 3, a discipline showing 5%, such as Architecture, would indicate that 5% of institutions that made a new assistant professor hire in 2023-24 hired a new assistant professor in Architecture. When a higher percentage is shown for a discipline, it was more common for institutions to invest in that discipline with new assistant professor hires in 2023-24. Since this analysis focused on new assistant professors, only tenure-track faculty were included. Additionally, only institutions that reported at least one new assistant professor hire in any discipline in 2023-24 were included in this analysis. Of the 782 institutions who participated in the Faculty Survey in 2023-24, 422 institutions reported at least one new assistant professor hire and were therefore included in the analysis.
Business was the discipline with the most institutions reporting new assistant professors in 2023-24. More than 1 in 4 (26%) institutions reported at least one new assistant professor in Business. Business was the most popular discipline for bachelor’s degrees in recent years,21National Center for Education Statistics. (2023). Most Common Undergraduate Fields of Study. likely due to the relatively high valuation of a business degree in the current job market.22Carnevale, A. P., Wenzinger, E., & Cheah, B. (2022). The Most Popular Degree Pays Off: Ranking the Economic Value of 5,500 Business Programs at More than 1,700 Colleges. Georgetown University Center on Education and the Workforce. As such, high rates of hiring new assistant professors in Business may reflect needs to meet increasing demand. Other disciplines thriving in terms of new assistant professors included Health Professions (24% of institutions), Visual/Performing Arts (22%), Biological/Biomedical Sciences (22%), and Education (21%). Very few institutions reported adding new assistant professors in the disciplines of Liberal Arts and Humanities (1% of institutions), Theology (1%), Library Science (2%), Engineering Tech (3%), and Consumer Sciences (3%).
Figure 3. Percentage of Institutions Reporting a New Assistant Professor for Each Discipline in 2023-24
Proportions of Non-Tenure-Track Faculty Have Increased in Every Discipline
Previous in-depth analyses have documented shifts in tenure status across all academic disciplines.23Schneider, J., & Bichsel, J. (2024). Representation and Pay Equity in Higher Education Faculty: A Review and Call to Action. CUPA-HR. Although nearly two-thirds (65%) of faculty are still tenure-track (TT), the proportion of non-tenure-track (NTT) faculty has been steadily increasing. Here we examine whether this decline in the proportion of TT faculty has occurred uniformly across disciplines over the past 10 years. CUPA-HR’s 2013-14 data collection was the first year to collect incumbent-level faculty data that distinguished TT and NTT faculty. Figure 4 shows the proportion of TT to NTT faculty for each discipline from 2013-14 to 2023-24. In 2013-14, most disciplines (79%) reported less than a quarter of faculty as being NTT. By 2023-24, there were marked shifts across disciplines toward a larger proportion of faculty being NTT, and most disciplines (72%) reported more than a quarter of faculty as being NTT. These findings indicate that, to an extent, there was some uniformity across disciplines toward an increased proportion of NTT faculty over time.
Some disciplines had particularly dramatic rates of change in the proportion of TT to NTT faculty in recent years. For example, Engineering Tech had a 21-percentage point increase in NTT faculty from 2013-14 to 2023-24. Other disciplines with drastic changes in the proportion of NTT faculty during this time included Health Professions (17-percentage point increase), Computer Science (15-percentage point increase), English Language/Literature (14-percentage point increase), and Mathematics and Statistics (14-percentage point increase). Other disciplines had much more gradual rates of change in TT to NTT faculty proportions. For example, Engineering only reported a 6-percentage point increase in NTT faculty from 2013-14 to 2023-24. Architecture was the only discipline to report a decrease in the proportion of NTT faculty during this period.
There were also noteworthy differences in the overall proportion of TT to NTT faculty by discipline. In 2023-24, some disciplines still had a relatively small proportion of faculty reported as NTT. For example, Engineering; History; Natural Resources/Conservation; Social Sciences; Philosophy/Religious Studies; Physical Sciences; Architecture; Area/Group Studies; and Psychology all showed 25% or less of their faculty as being NTT. In contrast, nearly two-thirds (61%) of faculty in both Health Professions and Liberal Arts and Humanities were NTT in 2023-24. Other disciplines with large proportions of NTT faculty in 2023-24 included Engineering Tech (46%), English Language/Literature (40%), and Mathematics and Statistics (37%).
Figure 4. Proportion of NTT to TT Faculty by Discipline From 2013-14 to 2023-24
Trends in Faculty Discipline Salaries From 2003-04 to 2023-24
There Has Been Minimal Change in the Highest-Paid and Lowest-Paid Disciplines Over 20 Years
Faculty are paid differently based on their discipline, and these salary differences tend to be consistent over time. As shown in Figure 5, there were very few differences in the 10 lowest-paid and 10 highest-paid disciplines in 2003-04 compared to 2023-24.24This analysis examined median salaries by discipline and included tenure-track and non-tenure-track teaching faculty. All faculty ranks were included. Computer Science, Engineering, Business, and Legal Professions were the top 4 highest-paid disciplines every year from 2003-04 to 2023-24. Business has been the highest-paid discipline since 2015-16. Past work highlights how Business faculty salaries tend to be higher than other fields due to competition with industry, and careers in the private sector for many areas of Business (e.g., finance, management, accounting) are typically more lucrative than working in higher ed.25Staples, J., Lowe, S. K., Collum, T. H. (2022). Faculty Salaries in Higher Education among Business and Other Fields of Study. Research in Higher Education Journal. Agriculture and Architecture were also in the 10 highest-paid disciplines every year from 2003-04 to 2023-24. Other disciplines that were consistently in the top 10 highest-paid disciplines over the past 20 years include Natural Resources/Conservation; Engineering Tech; Area/Group Studies; Biological/Biomedical Sciences; Social Sciences; and Health Professions.
There was also consistency in the lowest-paid disciplines each year from 2003-04 to 2023-24. Liberal Arts and Humanities; English Language/Literature; Visual/Performing Arts; Recreation/Fitness; Communication/Journalism; and Theology were in the 10 lowest-paid disciplines every year for the past 20 years. Other disciplines that regularly appeared in the 10 lowest-paid disciplines from 2003-04 to 2023-24 included History; Library Science; Foreign Languages/Literature; and Education. Altogether, the data indicate very little movement out of or into the highest- and lowest-paid disciplines over time.
Figure 5. The 10 Highest-Paid and 10 Lowest-Paid Disciplines in 2003-04 and 2023-24
Faculty Salaries Were Impacted by the Great Recession and the COVID-19 Pandemic
Higher education funding and spending were impacted by two major events over the past 20 years: the Great Recession in 2008 and the COVID-19 pandemic in 2020.26National Education Association. (2022). The Higher Ed Funding Rollercoaster: State Funding of Higher Education During Financial Crises. Trends in faculty salaries following these crises reflect the financial strains experienced across higher ed institutions. Figure 6 provides a year-to-year comparison of salary changes from 2003-04 to 2023-24 by discipline.27In this figure, data labeled as “2004” reflects percentage change in salary from 2003-04 to 2004-05 and so on. The year marked 2009 in Figure 6 reflects percentage change in salary from academic years 2008-09 to 2009-10. Faculty salaries in 2009 would likely show any recession-related impacts. In 2009, the median salary change across disciplines was just 0.85%, markedly lower than previous years. Although all disciplines had a smaller percentage increase in salary compared to years prior, there was still variability across disciplines in the level of assumed impact. Disciplines with the largest salary percentage increases during this time included Library Science; Business; Architecture; Health Professions; and Legal Professions. The disciplines with the smallest increases in salaries included English Language/Literature; Visual/Performing Arts; Consumer Sciences; Natural Resources/Conservation; and Philosophy/Religious Studies.
Similar to salary trends surrounding the Great Recession, the COVID-19 pandemic was followed by a pronounced decline in salaries and raises for faculty across disciplines. Based on CUPA-HR’s data collection schedule, the first period to measure pandemic-related effects is the comparison of salaries from academic years 2019-20 to 2020-21, marked as 2020 in Figure 6. During this time, the median salary increase across disciplines dropped to 0.33%, and even disciplines that appeared most resilient in response to the Great Recession experienced major declines in salary increases. For example, Business reported a 0.81% decrease in median salaries immediately following the start of the pandemic. However, this impact seemed to be relatively short-lived, as many disciplines showed a return to more typical salary increases in subsequent years. Some disciplines even appeared to compensate for pandemic-related losses in salary. For example, raises in 2021 through 2023 were high relative to preceding years for Legal Professions; Area/Group Studies; Business; Security/Protective Services; and Engineering.
Figure 6. Median Salary Raise Across Time From November 2003-04 to November 2023-24
From 2003-04 to 2023-24, Business Had the Largest Increase in Median Salary, Whereas Theology Had the Smallest Increase
Over the past 20 years, the median percentage change in salaries across disciplines ranged from 43.1% to 66.2%.28This analysis included all faculty ranks as well as both tenure-track and non-tenure-track teaching faculty. As shown in Figure 7, the discipline with the largest percentage change in salary during this time was Business (66.2%), followed by Natural Resources/Conservation (62.5%), Health Professions (57.7%), Security/Protective Services (52.7%), and Engineering (52.0%). On the other end of the spectrum, Theology (43.1%) had the smallest percentage increase from 2003-04 to 2023-24. Other disciplines with relatively small increases in salary were Library Science (43.7%), Communication/Journalism (44.1%), Education (44.5%), and English Language/Literature (44.6%).
Figure 7. Median Overall Percentage Change in Salary From 2003-04 to 2023-24
No Discipline’s Salary Increases Have Kept Up With Inflation Over the Past 20 Years
Tenure-track faculty have consistently received the lowest pay increases relative to all other higher ed employee groups (i.e., administrators, professionals, staff, and non-tenure-track faculty), and they were the only sector of employees in higher ed whose raise was below rates of inflation for 2023-24.29CUPA-HR. (2024). Workforce Pay Increases. Administrators generally hold leadership and senior-level administrative positions. Professionals typically require professional-level expertise, a baccalaureate degree or higher, and/or professional licensure. Staff tend to be non-exempt, paid hourly, and eligible for overtime. This data analysis examined if there were differences across disciplines in faculty salary increases relative to inflation rates from 2003-04 to 2023-24.30This analysis included all faculty ranks as well as both tenure-track and non-tenure-track teaching faculty. CUPA-HR Annual Workforce Data provides up-to-date insights on faculty pay increases. Figure 8 shows actual median salaries by discipline in 2003-04 and 2023-24. Median salaries were calculated for each discipline for 2003-04 and 2023-24. Then, inflation-adjusted salaries were calculated by applying changes in the Consumer Price Index during this period to generate expected median salaries if disciplines had kept up with inflation from 2003-04 to 2023-24.31Inflation was calculated by measuring changes in the Consumer Price Index from 2003-04 to 2023-24.
Figure 8. Median Salary by Discipline in 2003-04 and 2023-24
Percentages in Figure 9 show how actual median salaries in 2023-24 compared to the inflation-adjusted salary calculations. These percentages reflect changes in purchasing power based on comparisons between actual salary increases and inflation-adjusted salaries over the past 20 years. If salary increases exactly matched inflation changes, the percentage in the figure for that discipline would be 0%. A negative percentage value indicates salary increases fell behind inflation, whereas a positive percentage value indicates salary increases surpassed inflation. As shown in Figure 9, all disciplines’ actual median salaries in 2023-24 were below the inflation-adjusted salaries based on salaries in 2003-04. In other words, there was not a single discipline that kept up with inflation from 2003-04 to 2023-24, and faculty across all disciplines lost purchasing power over time. Some of the disciplines that were closest to keeping up with inflation included Business; Biological/Biomedical Sciences; Health Professions; Agriculture; and Liberal Arts and Humanities. The disciplines with actual salaries that were furthest from their inflation-adjusted salaries were Legal Professions; Engineering Tech; Library Science; Education; and Architecture. In summary, all disciplines are paid less now compared to their purchasing power in 2003-04, but there has been variability across disciplines in how much purchasing power was lost over the past 20 years.
Figure 9. Percentage Change in Purchasing Power From 2003-04 to 2023-24
Conclusions
Despite the critical role of faculty in higher ed, prior analyses underscore concerning trends in this workforce including declining tenure-track appointments and relatively low pay increases.32Schneider, J., & Bichsel, J. (2024). Representation and Pay Equity in Higher Education Faculty: A Review and Call to Action. CUPA-HR. However, these trends vary across programs as colleges and universities face increasing pressures to prioritize disciplines that are in higher student demand and perceived as directly connected to job preparation. In line with prior research, disciplines in STEM fields and those that are generally seen as easily translatable from degree to career experienced the most growth and highest salary increases over the past 20 years. Below, we synthesize findings across analyses for several disciplines that fared exceptionally well or poorly in growth and pay during this period. Then, we conclude with broader takeaways and recommendations.
Discipline Highlights
Health Professions showed the most growth over the past 20 years, more than doubling the number of faculty from 2003-04 to 2023-24. Health Professions also had the second highest rate of hiring new assistant professors in 2023-24, indicating continued growth in this discipline across institutions. This growth may reflect increasing demand for healthcare workers caused in part by an aging U.S. population. Health Professions also had drastic shifts in tenure status proportions over time and had the largest proportion of non-tenure-track faculty relative to all disciplines in 2023-24. Despite the large proportion of non-tenure-track faculty, whose base salaries are often lower than tenure-track faculty, Health Professions was consistently one of the highest-paid disciplines with the third largest percentage increase in median salary from 2003-04 to 2023-24. These findings lend support to a shifting emphasis in higher ed to programs that translate well from degree to career path.
Business was another discipline that fared well across size and pay metrics. Business had the highest rate of hiring new assistant professors in 2023-24. This is on top of a consistent increase in discipline size over the past 20 years, as Business grew by 20.8% from 2003-04 to 2023-24. Business is one of the most commonly awarded degrees, and the growth in Business faculty is likely attributable to the popularity of Business and need to meet student demands. Business ranked among the top four highest-paid disciplines every year from 2003-04 to 2023-24 and was the highest-paid discipline for the past nine years. In addition, Business reported the largest percentage increase in median salary across all disciplines with an increase of 66.2% since 2003-04 and was the closest discipline to keeping up with inflation. High earnings among Business faculty may in part reflect heavy competition with the private sector for Business Ph.D.s.
English Language/Literature was one of just five disciplines to report fewer faculty in 2023-24 compared to 2003-04. In addition, English Language/Literature reported major increases in the proportion of non-tenure-track faculty, with approximately 40% of faculty being non-tenure-track in 2023-24. This discipline also ranked among the 10 lowest-paid disciplines every year since 2003-04 and reported one of the smallest percentage increases in median salary over the past 20 years. Altogether, these findings suggest broad divestment in English Language/Literature.
Liberal Arts and Humanities was another discipline that shrank in number of faculty from 2003-04 to 2023-24. In 2023-24, only 1% of institutions hiring new faculty added a new assistant professor in Liberal Arts and Humanities, indicating a lack of ongoing investments in the discipline. Liberal Arts and Humanities also currently has one of the largest proportions of non-tenure-track faculty at 61% and ranked among the 10 lowest-paid disciplines every year from 2003-04 to 2023-24. In summary, the size and salary data collected over the past 20 years underscore a de-emphasis on disciplines that are viewed to be less clearly translatable from degree to career.
Key Takeaways
Some disciplines reported significant faculty growth over the past 20 years while others shrank. Almost all disciplines reported more faculty in 2023-24 versus 2003-04. The exceptions with fewer faculty in 2023-24 compared to 2003-04 included Engineering Tech; English Language/Literature; Liberal Arts and Humanities; Consumer Sciences; and Education. Disciplines with the greatest growth over the past 20 years included Health Professions; Library Science; Biological/Biomedical Sciences; Area/Group Studies; and Security/Protective Services.
Although the trend toward increasing proportions of non-tenure-track faculty was present across disciplines, there were notable differences in rates of change and overall tenure status proportions by discipline. Importantly, proportions of tenure status did not always translate to higher median salaries or larger changes in salaries over time. For example, Health Professions and Liberal Arts and Humanities were tied for the largest proportion of non-tenure-track faculty in 2023-24 at 61%; however, Health Professions was consistently one of the highest-paid disciplines over time while Liberal Arts and Humanities has been among the 10 lowest-paid disciplines since 2003-04.
Historic events sometimes coincided with lower salary raises and reductions in faculty numbers. In the year following the start of the COVID-19 pandemic, almost all disciplines reported fewer faculty compared to the previous year. The only disciplines to report an increase in number of faculty were Area/Group Studies; Computer Science; Security/Protective Services; Public Administration/Social Service; and Health Professions. In addition, although all disciplines reported relatively small raises directly after the Great Recession and the pandemic, many disciplines that generally experienced high growth and large salary increases over time (e.g., Business, Legal Professions, Health Professions) reported higher raises during these periods compared to disciplines that tended to have less growth and smaller pay increases (e.g., English Language/Literature, Consumer Sciences, Visual/Performing Arts) over the past 20 years.
No discipline beat inflation. Although many disciplines appeared strong based on changes in size and salary over time, all disciplines reported median salaries in 2023-24 that were lower than inflation-adjusted salaries based on 2003-04 salary data. Overall, faculty in all disciplines have less purchasing power with their salaries in 2023-24 than they did in 2003-04. In effect, this means that faculty in all disciplines are paid less in 2023-24 than they were 20 years prior.
Recommendations
Higher education leaders should consider the implications of the trends highlighted in this report. This report’s findings show that, over the past two decades, faculty median salaries across all disciplines have not kept up with inflation. In addition, colleges and universities have invested less in the humanities and liberal arts and turned toward disciplines that more directly translate from degree to career. In light of these findings, colleges and universities, and particularly their faculty and leaders, should consider the following:
Work to annually adjust salaries to keep up with inflation. Despite steady increases in pay for many disciplines over time, every discipline fell short of keeping up with inflation. All faculty were paid less in 2023-24 than they were in 2003-04 in inflation-adjusted dollars. To retain and attract talented faculty, colleges and universities should audit their institution’s salaries and ensure their faculty pay is, at minimum, keeping up with rates of inflation. Higher education leaders can use the results of this report to advocate for faculty salary increases at their institution.
Continuously evaluate programs to ensure offerings meet the needs of student populations. As noted previously, growth in the Health Professions discipline can likely be attributed in part to changing demographics (e.g., the aging U.S. population) and the need for more healthcare professionals. These programs are essential to supplying the workforce with technical experts, and the expansion of these programs reflects a practical investment to prepare students for high-demand jobs. Faculty and leaders should critically evaluate how well programs across disciplines are preparing students in response to evolving technologies and public needs. As higher ed institutions contend with limited resources, declining enrollment, and a volatile political environment, it may be more critical than ever to maintain a pulse on the specific needs of local and global populations, ensuring graduates are able to find well-paying, meaningful work.
Higher education institutions may consider how they can better convey the value of liberal arts and humanities degrees and courses to students, employers, and society at large. A narrow focus on degree-to-career programs may not adequately prepare students for current and future workforce needs. In addition to teaching students technical, job-specific skills, a college degree should prepare students to manage novel and complex challenges that require analytical thinking, empathy, and creativity.33Mintz, S. (2025, March 25). The Case for a More Engaged, Holistic College Education. Insider Higher Ed. The liberal arts and humanities provide students with these valuable and versatile skillsets that may be more flexibly applied to address the complex and uncertain needs of the future workforce.34Carlson, S., & Laff, N. (2025, January 21). The Hidden Utility of the Liberal Arts. The Chronicle of Higher Education. An education in these disciplines prepares students for successful careers by developing skills in areas such as communication, writing, critical thinking, and ethical judgment, all of which are essential in today’s knowledge economy. Faculty and leaders may consider creative strategies, such as offering badges or certificates in liberal arts fields,35Weissman, S. (2024, May 8). Liberal Arts Microcredentials on the Rise. Inside Higher Ed. to broadly communicate the value of an education in the liberal arts and humanities and effectively prepare students for the future.
About the Authors:
Brielle Johnson, Ph.D., is a survey researcher at CUPA-HR.
Melissa Fuesting, Ph.D., is associate director of research at CUPA-HR.
Graphics were created by Kate Roesch, data visualization developer at CUPA-HR.
Citation for This Report:
Johnson, Brielle, & Fuesting, Melissa. (2025, May). Two Decades of Change: Faculty Discipline Trends in Higher Education. CUPA-HR. https://www.archive.cupahr.org/surveys/research-briefs/two-decades-of-change-faculty-discipline-trends-in-higher-ed-may-2025/
Printer-friendly Version 1 Ahmed, S. (2024, July 8). The Death of Humanities Education: Why We Need to Revalue the Arts and Sciences. Medium.